2023. 11. 12. 17:15ㆍ소소한 개발
Spring Boot(Security) + Prometheus(모니터링) + Grafana(시각화) + Docker(docker-compose) + Oracle Cloud 구축

현재 토이프로젝트로 하고 있는 사이트에서 프로메테우스와 그라파나를 이용해 모니터링을 구축해보려고 했습니다.
사용한 기술 및 상태는 아래를 확인해 주세요.
Spring Boot 애플리케이션을 운영하고 있다는 가정하게 모니터링 시스템을 구축해 보았습니다.
실제 운영과는 많이 다를 수 있다는점, 공부용으로 구축할 때 참고용으로 포스팅했습니다.
Spring Boot(v2.7.16), Spring Security, JWT
Prometheus, Grafana
Oracle Cloud, Docker
※ Local에서는 Spring Boot - Prometheus의 연동까지만 테스트했습니다.
Oracle Cloud에서는 Spring Boot(Docker) - Prometheus(Docker) - Grafana(Docker)로 구축했습니다.
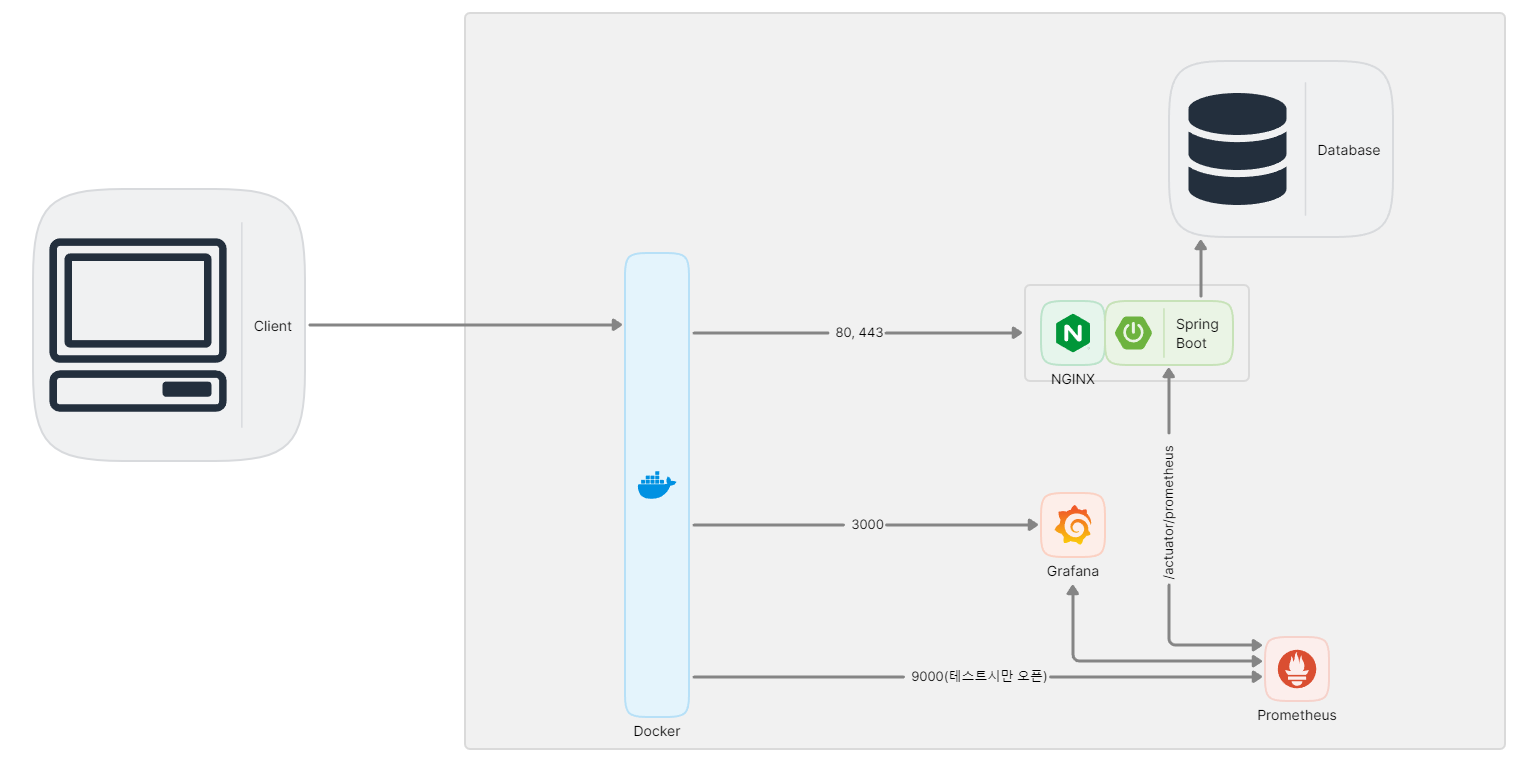
전체적인 구조
Spring Boot Actuator
Production-ready Features
You can enable recording of HTTP exchanges by providing a bean of type HttpExchangeRepository in your application’s configuration. For convenience, Spring Boot offers InMemoryHttpExchangeRepository, which, by default, stores the last 100 request-response
docs.spring.io
prometheus
Download | Prometheus
An open-source monitoring system with a dimensional data model, flexible query language, efficient time series database and modern alerting approach.
prometheus.io
Grafana
Grafana: The open observability platform | Grafana Labs
Play around with the Grafana Stack Experience Grafana for yourself, no registration or installation needed.
grafana.com
Spring Boot
dependence 추가
    // 모니터링
    implementation 'org.springframework.boot:spring-boot-starter-actuator' // 애플리케이션의 지표를 제공
    implementation 'io.micrometer:micrometer-registry-prometheus' // 제공된 지표들을 DB에 저장하고 이를 활용한 편의 기능을 제공
spring-boot-starter-actuator와 io.micrometer:micrometer-registry-prometheus를 추가합니다.
application.yml 설정 추가
management:
  endpoints:
    web:
      exposure:
        include: "*"
spring-boot-starter-actuator에서 어떤 정보를 보여줄지 설정합니다. 가급적 필요한 정보만 하는것을 추천드리며 저는 테스트 목적으로 구축하였기 때문에 모든 정보를 노출했습니다.
만약 제한된 정보만 노출할 경우 prometheus는 추가해주셔야 합니다.
Spring Security 설정 변경
 @Bean
    public WebSecurityCustomizer webSecurityCustomizer() {
        return (web) -> web
                .ignoring().antMatchers("/actuator/**"); //here
    }


@Bean
public SecurityFilterChain filterChain(HttpSecurity http) throws Exception {
    // 권한 부여 규칙 Settings
    http
            .authorizeRequests()
            .antMatchers("/actuator/**").permitAll() //here
            .anyRequest().authenticated();

}
정보는 actuator url로 제공하기 때문에 해당 url을 추가합니다.
application 실행 및 테스트
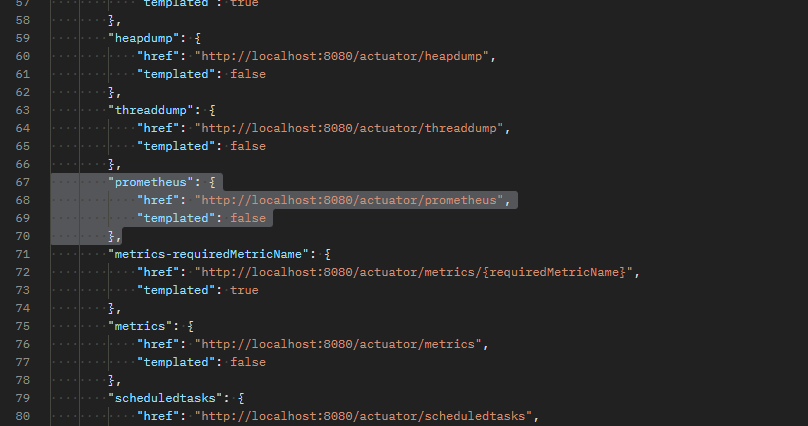
http://localhost:8080/actuator에 접속해 보면 actuator가 제공하는 엔드포인트 목록이 나오면 성공입니다.
그중에서 /actuator/prometheus가 있는지 확인해야 합니다.
차후 서버에서 /actuator/prometheus 해당 endpoint를 사용할겁니다.
프로메테우스 설치(로컬 테스트, 윈도우)
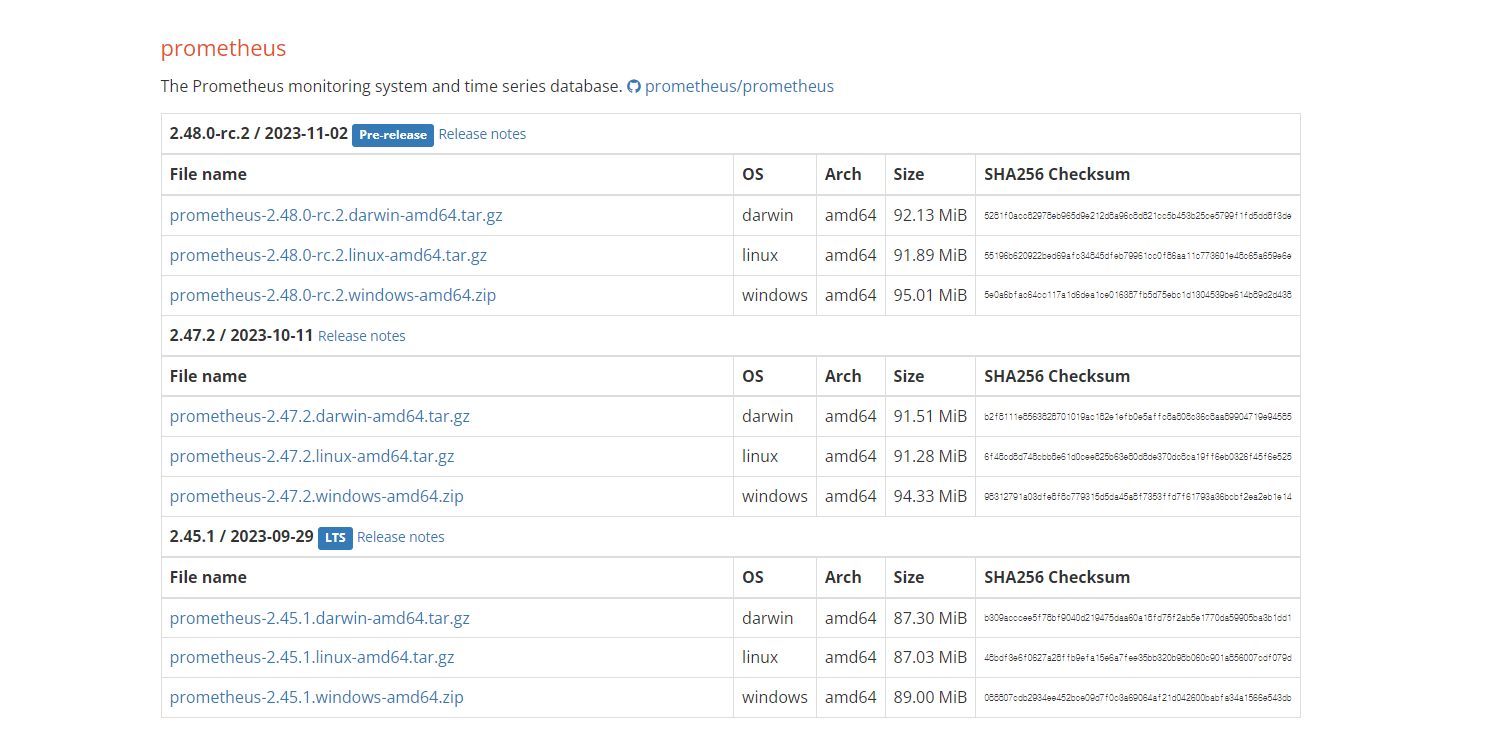


자신의 OS 환경에 맞는 프로메테우스를 다운로드합니다.
우선 로컬 연결부터 하고 난 뒤 Oracle Cloud의 ubuntu에 적용해 보겠습니다.
prometheus.yml파일을 열고
1. metrics_path: "/actuator/prometheus" 추가
2. targets: ["localhost:8080"] 수정 //(Spring Boot port)
이후 저장합니다.
이후 prometheus.exe를 실행하면 console창이 나오면 됩니다.
접속 : http://localhost:9090
프로메테우스는 기본적으로 9090포트로 접속이 가능합니다.
로컬에서는 metrics_path와 targets가 어떤 역활인지만 파악 수 server 환경에 맞추어 변경해야 합니다.
아래에서 서버의 Docker 환경에 맞추어 prometheus.yml를 수정해보겠습니다.

프로메테우스 메인화면에서 Status - Target에 접속해줍니다.
http://localhost:8080/actuator/prometheus의 State가 UP이면 성공입니다.
UP이 아니면 우측 Error를 확인하면 됩니다. Spring Security를 사용하면 config를 확인해 줍니다. 혹은 JWT 문제일 수 있으니 네트워크 환경을 확인 후 해결하면 됩니다.
Spring Boot 설정은 끝났습니다.
Oracla Cloud(Ubuntu) 서버 설정
3000번, 9090포트를 열어야 합니다.
이후 prometheus의 9090포트는 막고 3000번 포트만 사용할것입니다. (테스트시 9090포트 오픈)
Oracle cloud의 방화벽 설정 및 포트 오픈 설정은 아래포스팅에서 확인해주세요
Oracle Cloud 방화벽 설정(Ubuntu 22.04)
Oracle Cloud 방화벽 설정(Ubuntu 22.04) 오라클 클라우드에서 외부에서 접속하려면 2번 방화벽을 설정해야 합니다. 오라클 클라우드 방화벽(VCN)과 Ubuntu OS 내부 방화벽을 설정해야 비로소 외부에서 접
adg0609.tistory.com
docker-compose 설정
애플리케이션용 docker-compose.yml와 모니터링용 docker-compsoe-monitoring.yml 2개로 분할했습니다.
모니터링은 애플리케이션이 장애로 꺼지거나 재부팅시에도 살아서 애플리케이션이 꺼져있나 확인해야 하기 때문에 분리를 진행했습니다.
spring boot의 docker-compose.yml
version: '3.9'

services:
  backend-dev:
    image: spring boot
    container_name: backend-dev
    expose:
      - 8081


  frontend-dev:
    image: react
    container_name: frontend-dev
    ports:
      - "80:80"
spring boot는 외부에서도 접근이 안되도록 expose로 8081 포트를 적용했습니다.
prometheus는 다른 컨네이버의 내부 포트인 8081을 바라보게 해야 합니다.
prometheus, grafana의 docker-compose-monitoring.yml
version: '3.9'

services:
  prometheus:
    image: prom/prometheus
    container_name: prometheus
    ports:
      - "9090:9090"
    volumes:
      - (경로)/config/prometheus/prometheus.yml:/etc/prometheus/prometheus.yml

  grafana:
    image: grafana/grafana
    container_name: grafana
    user: "$UID:$GID"
    ports:
      - "3000:3000"
    volumes:
      - (경로)/data/grafana:/var/lib/grafana
    restart: always
    depends_on:
      - prometheus
prometheus의 volumes같은 경우 default설정이 아닌, 서버의 환경에 맞게 변경해야 합니다.
prometheus.yml은 아래를 확인해 주세요.
grafana는 /var/lib/grafana경로에 .db가 저장되기 때문에 서버로 저장되게 설정했습니다.
prometheus.yml
global:
  scrape_interval: 15s # Set the scrape interval to every 15 seconds. Default is every 1 minute.
  evaluation_interval: 15s # Evaluate rules every 15 seconds. The default is every 1 minute.
  # scrape_timeout is set to the global default (10s).

# Alertmanager configuration
alerting:
  alertmanagers:
    - static_configs:
        - targets:
          # - alertmanager:9093

# Load rules once and periodically evaluate them according to the global 'evaluation_interval'.
rule_files:
# - "first_rules.yml"
# - "second_rules.yml"

# A scrape configuration containing exactly one endpoint to scrape:
# Here it's Prometheus itself.
scrape_configs:
  # The job name is added as a label `job=<job_name>` to any timeseries scraped from this config.
  - job_name: "backend-dev"
    # metrics_path defaults to '/metrics'
    # scheme defaults to 'http'.
    metrics_path: "/actuator/prometheus"
    static_configs:
      - targets: ['backend-dev:8081']
targets를 spring boot가 실행되는 docker 컨테이너 이름으로 변경 후 8081 포트를 주면 됩니다.
만약 network를 사용하고 있다면 모두 같은 network를 사용해야 합니다.

컨테이너를 실행합니다.
prometheus 접속 및 확인
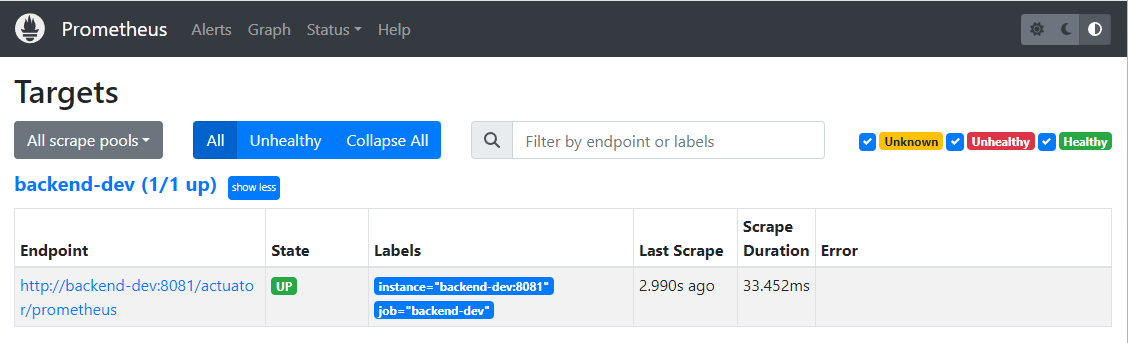
서버ip:9090으로 접속 후 targets를 확인합니다.
state가 UP으로 되어 있으면 잘 연결되었습니다. Error가 있다면 Error를 확인해 주세요.
이후 최종적으로 grafana까지 연결되면 9000번 포트는 방화벽으로 닫으셔야 합니다. 보안에 취약합니다.
우리는 이제 grafana로 접속해서 promethues가 받아오는 데이터를 시각화할것입니다.
grafana 접속 및 연동

서버ip:3000로 접속하게 되면 Grafana의 로그인 화면이 나옵니다.
초기 세팅은 admin/admin이며 비밀번호를 바꿀것을 추천드립니다.


Add your first data source - Prometheus 클릭해서 추가합니다.
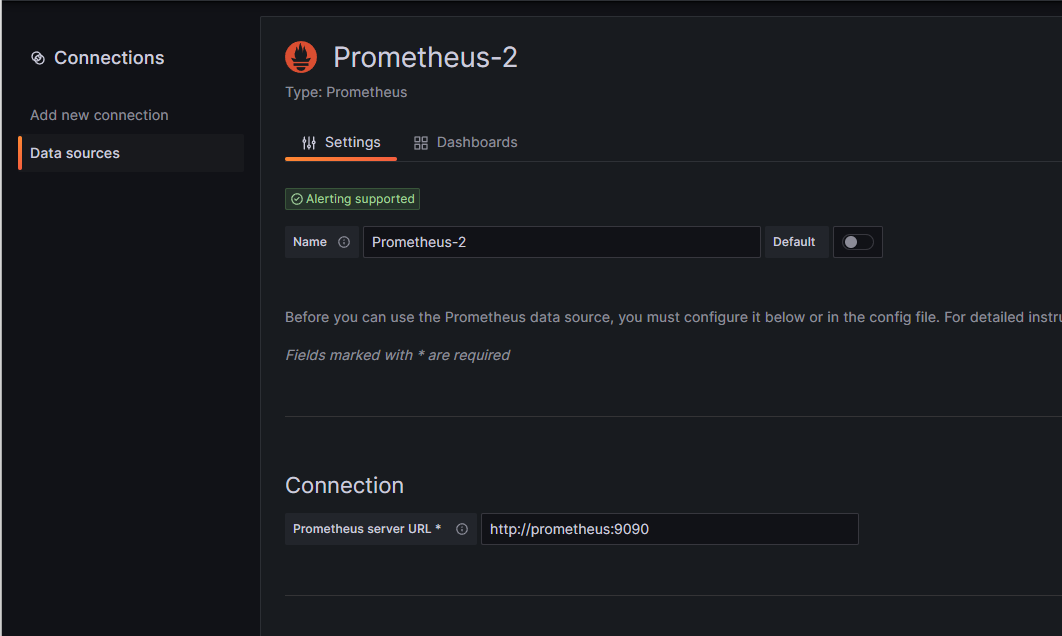

Connection URL에 prometheus의 컨테이너 이름:9090 을 추가합니다.
ip로 할 경우 9090포트는 외부에서 접근을 방화벽으로 막기 때문에 안됩니다. 컨테이너끼리 연결해야 합니다.
아래로 좀 더 내린 후 Save & test에서 Successfully가 뜨면 연동 끝!
이제 커스텀도 가능하지만 다양한 템플릿을 다운받아서 적용하겠습니다.
grafana dashboard Template
Dashboards | Grafana Labs
Thank you! Your message has been received!
grafana.com
가장 유명한건 JVM (Micrometer)이며 Spring boot도 많으니 찾아서 적용합니다.
하나의 Tempalte를 클릭 후 우측에 Import the dashboard template 클릭하면 됩니다.
ID가 클립보드에 복사됩니다.
Template 적용
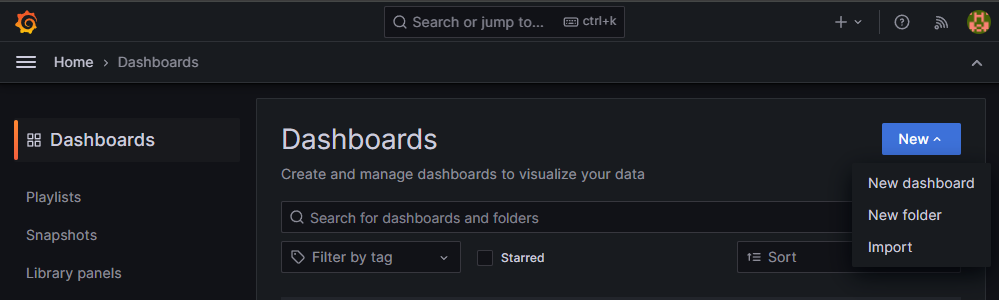
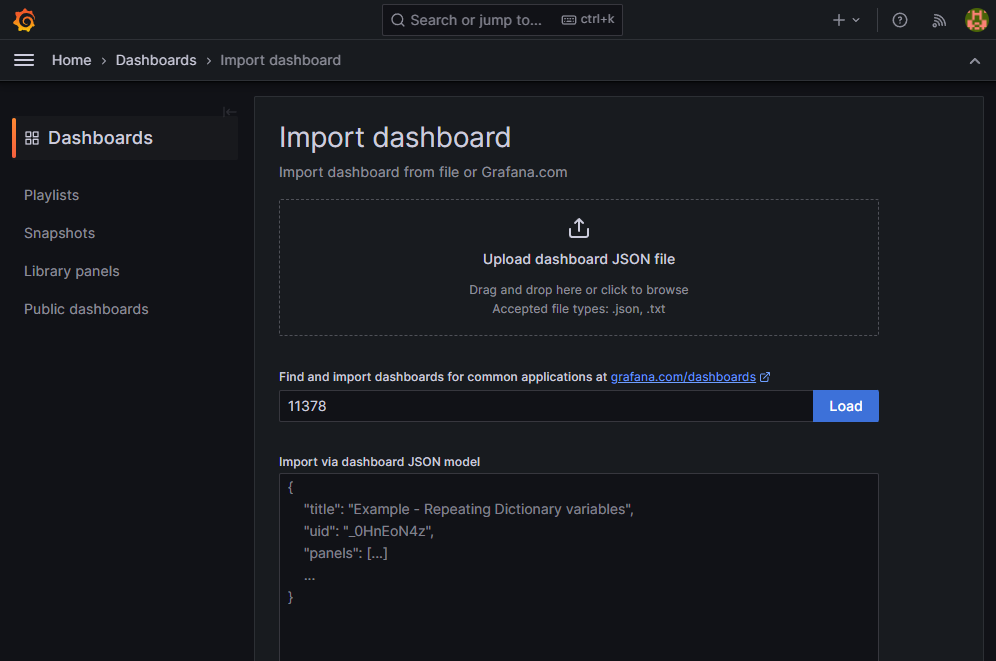
Dashboards에서 New - import 후 위에서 복사했던 ID를 Load하면 됩니다.
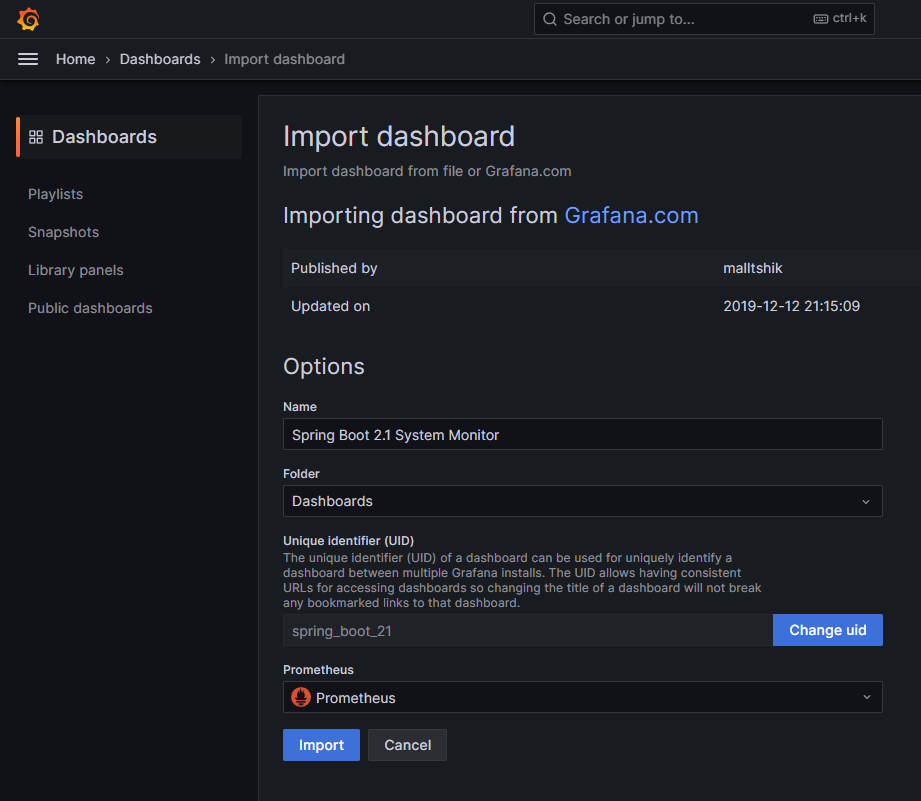
아래에서 Prometheus를 추가해주고 Import하면 끝입니다.

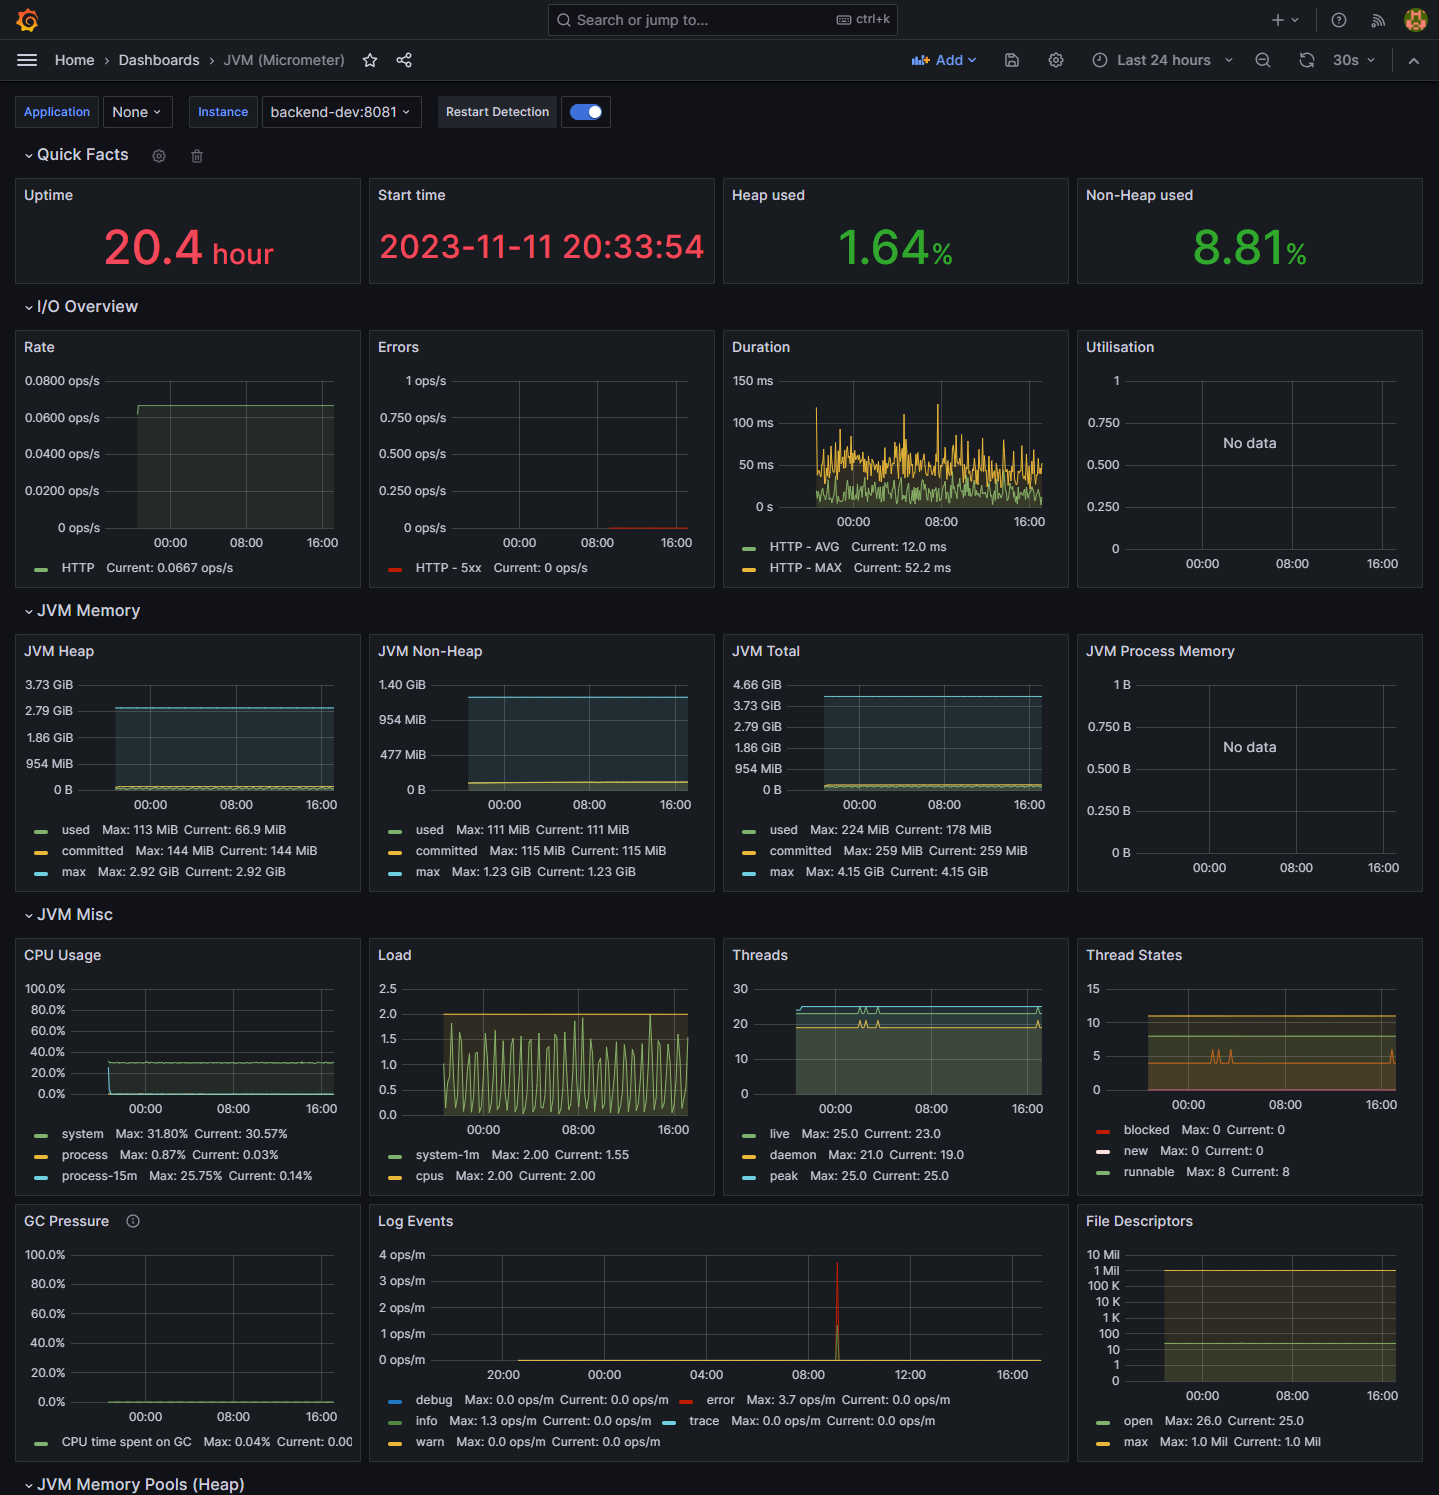
여러 Template를 사용해서 모니터링을 할 수 있습니다.
'소소한 개발' 카테고리의 다른 글
| 백준 깃허브(Github) 연동 (백준허브) (0) | 2024.12.15 |
|---|---|
| Google Map API 일본해(동해)로 나오는 문제 수정 방법(React) (0) | 2023.07.28 |
| 개인 블로그 만들기(6) : [서버구축] Oracle Cloud Docker Tomcat 구축 및 배포 (1) | 2021.09.09 |
| 개인 블로그 만들기(5) : [서버구축] Oracle Cloud Docker MariaDB 연동 (0) | 2021.09.03 |
| 개인 블로그 만들기(1) : [서버구축] Oracle Cloud 인스턴스 생성 (0) | 2021.09.02 |